

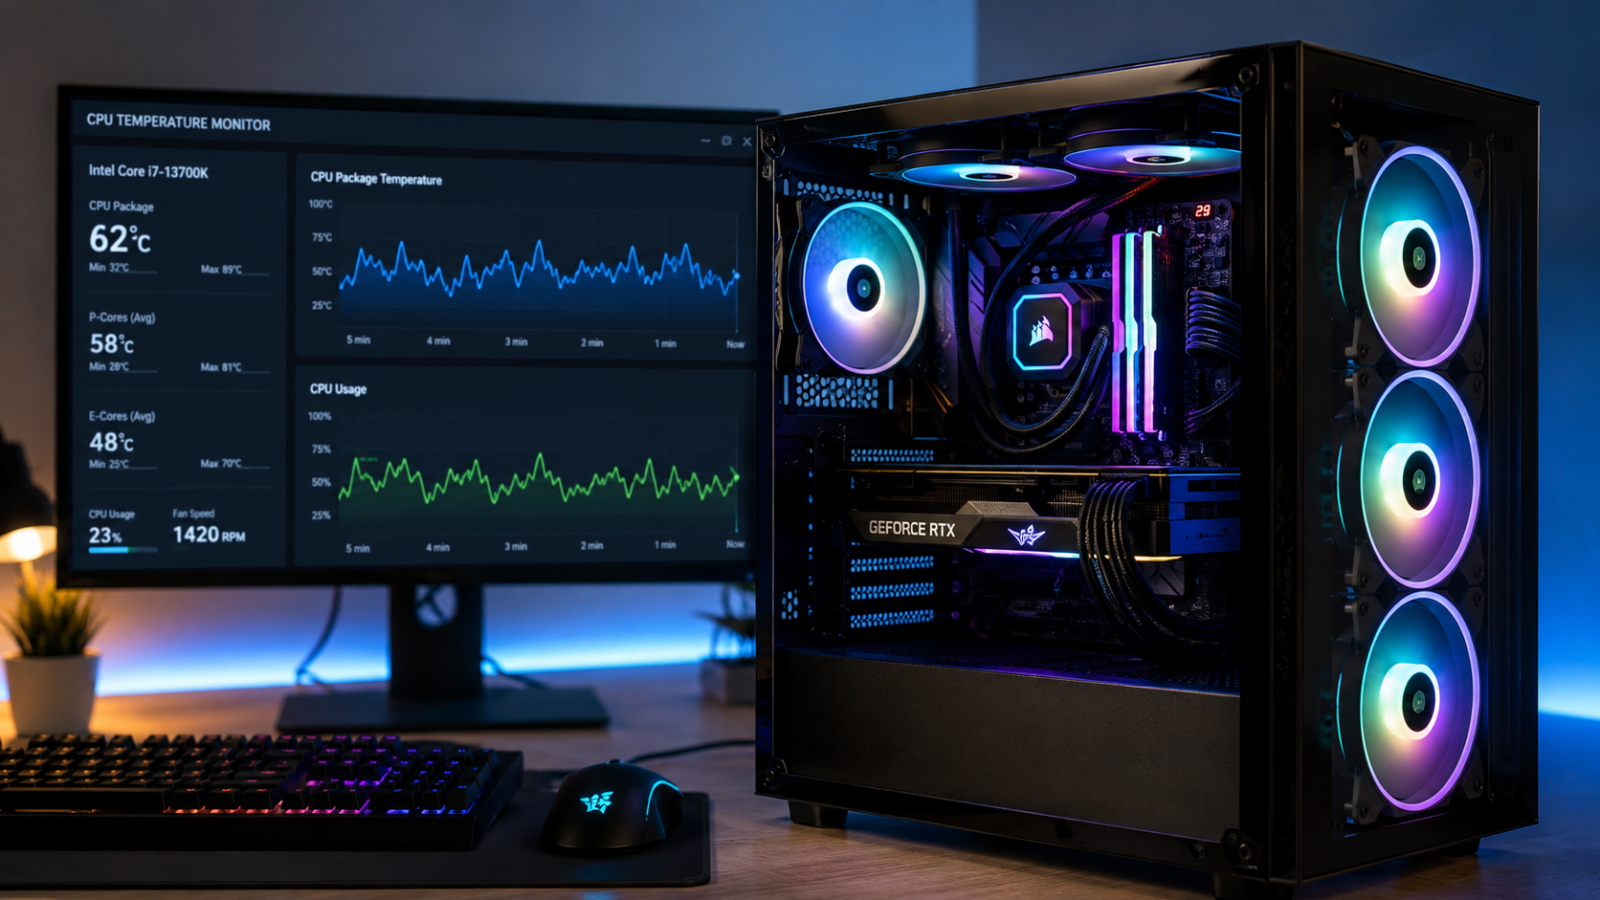
If your PC has ever randomly stuttered mid-game or shut down out of nowhere, temperature is one of the first things worth checking. A CPU heat monitor gives you a real-time look at what your processor is actually doing thermally, instead of leaving you to guess based on fan noise or gut feeling. Once you start watching the numbers, a lot of “mystery” PC problems suddenly make a lot more sense.
This guide walks through what CPU heat monitoring actually means, what counts as a normal temperature, how to check it on Windows, which tools are worth using, and what to do if your numbers are running hotter than they should.
What Is a CPU Heat Monitor?
A CPU heat monitor is a piece of software (sometimes paired with BIOS-level sensors) that reads the temperature data coming directly off your processor and displays it in a way you can actually understand. Every modern CPU has built-in digital thermal sensors sitting close to the processor die. These sensors constantly report heat data to the motherboard, and monitoring software simply reads that data and puts it on your screen in real time.
CPU temperature monitoring matters because heat is the main limiting factor in how hard a processor can work. CPUs are designed with safety thresholds, and when they get close to those limits, they start protecting themselves automatically — usually by slowing down. Without a way to see this happening, you’d only notice the symptom (a slower or crashing PC) without ever knowing the cause.
Modern processors run faster and hotter than older generations, packing more transistors into a smaller space. That’s exactly why thermal monitoring has become a standard part of PC maintenance rather than something only enthusiasts bother with.
Why Should You Use a CPU Heat Monitor?
Keeping an eye on your CPU temperature isn’t just for overclockers. There are practical, everyday reasons to run a CPU heat monitor:
- Preventing overheating before it causes instability or shutdowns
- Catching cooling problems early, like a fan that’s stopped spinning or a cooler that’s lost contact
- Avoiding thermal throttling, where the CPU deliberately reduces its speed to cool down
- Protecting long-term CPU performance and lifespan
- Monitoring temperatures during gaming, when load is sustained and heat builds up fastest
- Spotting fan or cooler issues before they turn into bigger hardware problems
Think of it the same way you’d think of a car’s temperature gauge. You don’t need to stare at it constantly, but you definitely want it visible before something goes wrong, not after.
What Is a Normal CPU Temperature?
This is the question almost everyone searching for a CPU heat monitor eventually asks, and the honest answer is: it depends. Normal CPU temperature varies based on the specific processor, the cooler installed, case airflow, ambient room temperature, and even motherboard power settings. That said, here are general ranges most desktop CPUs fall into:
| Condition | Typical Temperature Range |
|---|---|
| Idle | 30–45°C |
| Normal desktop use | 40–55°C |
| Gaming | 60–75°C |
| Heavy workloads (rendering, compiling) | 70–80°C |
| Stress testing | 75–90°C (varies significantly by CPU) |
These numbers are general guidelines, not hard rules. A high-end gaming CPU under full load might comfortably sit at 80°C with a strong cooler, while a budget chip hitting the same number with a weak stock cooler could be a warning sign. Always check your specific CPU manufacturer’s documentation for the maximum safe operating temperature (often listed as “Tjunction” or “Tjmax”) rather than assuming one number applies to every processor.
How to Check CPU Temperature on Windows
You don’t need advanced technical knowledge to check CPU temperature on Windows. Here are the main methods, from simplest to most detailed.
1. Check in the BIOS/UEFI
Restart your PC and enter the BIOS (usually by pressing Delete, F2, or F10 during boot — it varies by motherboard). Most BIOS screens display CPU temperature on the main dashboard. This gives you an idle reading since nothing is under load at that point.
2. Use CPU monitoring software
For real-time monitoring while actually using your PC, dedicated software is far more useful than the BIOS. Install a reputable CPU temperature monitor, open it, and it will display live readings directly on your desktop or in a small overlay.
3. Use manufacturer utilities
Some CPU and motherboard manufacturers offer their own monitoring utilities that show temperature alongside voltage, clock speed, and fan data. These can be convenient if you already have the software installed for other reasons.
4. Use hardware monitoring utilities
More advanced hardware monitoring tools track temperature over time, log sensor history, and show detailed readouts for every core individually — useful if you’re troubleshooting a specific issue rather than just doing a quick check.
Best CPU Heat Monitor Software
There are several well-regarded tools for CPU temperature monitoring. Each has a slightly different focus, so the “best” one really depends on what you need it for. As always, check the developer’s site for the current version and feature set before downloading, since software updates over time.
HWMonitor A straightforward, beginner-friendly tool that displays temperature, voltage, and fan speed for your CPU and other components.
- Best for: Users who want a simple, no-frills readout
- Advantages: Lightweight, easy to read, minimal setup
- Limitations: Doesn’t offer in-depth logging or historical graphing
HWiNFO A more advanced monitoring suite that provides extremely detailed sensor data, including per-core temperatures and long-term logging.
- Best for: Enthusiasts and anyone troubleshooting a specific thermal issue
- Advantages: Very detailed, highly customizable, supports logging over time
- Limitations: Can feel overwhelming for casual users due to the sheer amount of data
Core Temp A lightweight, dedicated CPU temperature monitor that focuses specifically on per-core readings.
- Best for: Users who just want CPU-specific data without extra system information
- Advantages: Minimal resource usage, simple interface, customizable system tray display
- Limitations: Doesn’t cover other components like GPU or storage temperatures
MSI Afterburner (with RivaTuner Statistics Server) Primarily a GPU overclocking tool, but it can also display CPU temperature as an on-screen overlay during gameplay.
- Best for: Gamers who want temperature data visible in-game
- Advantages: Real-time overlay during gaming, customizable display
- Limitations: More setup involved if you only care about CPU temperature specifically
Motherboard manufacturer software (ASUS, MSI, Gigabyte, ASRock, etc.) Most motherboard brands offer their own system monitoring tools bundled with drivers.
- Best for: Users who want temperature monitoring alongside fan curve and BIOS-adjacent controls
- Advantages: Often integrates directly with fan control settings
- Limitations: Can be resource-heavier than dedicated third-party tools
How to Monitor CPU Temperature While Gaming
Gaming pushes the CPU harder than most everyday tasks because it sustains high usage over long periods, especially in demanding or CPU-bound titles. That sustained load is exactly why temperatures climb higher and stay elevated longer during gaming sessions than during typical browsing or office work.
To monitor CPU temperature while gaming, most people use an on-screen overlay from tools like MSI Afterburner or HWiNFO, which display live temperature readings in the corner of the screen without needing to alt-tab out of the game.
While gaming, keep an eye on:
- Whether temperatures climb steadily and then plateau (normal) or spike erratically (worth investigating)
- Clock speed alongside temperature — if speeds drop while temperature is high, that’s a sign of thermal throttling
- Whether FPS drops correlate with temperature spikes, which often points to a cooling issue rather than a software or game-related one
If your frame rate dips specifically during longer play sessions rather than right at launch, heat buildup is a reasonable thing to rule out first.
How to Tell If Your CPU Is Overheating
A few warning signs tend to show up when a CPU is running hotter than it should:
- Unexpected shutdowns or restarts, especially under load
- System crashes or freezing during demanding tasks
- Noticeable performance drops mid-session
- Thermal throttling (lower clock speeds despite high workload)
- Louder-than-usual fan noise as the system tries to compensate
- Consistently high temperature readings across monitoring tools
If you’re seeing more than one of these at once, it’s worth opening a CPU heat monitor and watching the numbers during normal use to see whether temperature lines up with when the problems occur.
How to Lower CPU Temperature
If your CPU heat monitor is showing higher-than-expected numbers, there are several practical fixes worth trying, roughly in order of how easy they are:
- Clean out dust from fans, filters, and heatsinks — this alone fixes a surprising number of overheating cases
- Improve case airflow by checking that intake and exhaust fans are balanced and unobstructed
- Check that your CPU fan is actually spinning at the speed it should be
- Reinstall or upgrade your CPU cooler if contact with the CPU seems poor or the cooler is undersized for your chip
- Replace old thermal paste if it’s been several years since it was last applied — dried-out paste loses effectiveness over time
- Improve cable management to reduce airflow blockages inside the case
- Close unnecessary background programs that quietly load the CPU without you noticing
- Adjust fan curves in your BIOS or motherboard software so fans ramp up sooner under load
- Improve room ventilation, since ambient temperature directly affects how hard your cooler has to work
- Consider undervolting, but only if you’re comfortable with the process — undervolting can reduce heat and power draw, but incorrect settings can cause instability, so research your specific CPU model first
CPU Heat Monitor vs CPU Temperature Monitor
These two terms are essentially interchangeable — “CPU heat monitor” and “CPU temperature monitor” both refer to the same category of tool: software that reads and displays your processor’s thermal sensor data. What actually matters when choosing one isn’t the terminology, but the features: accurate per-core readings, real-time updates, an optional gaming overlay, and (if you want to troubleshoot issues) historical logging.
Frequently Asked Questions
What is the best CPU heat monitor? There isn’t a single “best” one — it depends on your needs. Core Temp and HWMonitor are great for simple, quick checks, while HWiNFO suits users who want detailed, per-core data and logging.
How do I check my CPU temperature? You can check it in your BIOS/UEFI for an idle reading, or install monitoring software like HWMonitor or Core Temp for real-time readings while using your PC.
What CPU temperature is too high? This depends on your specific CPU model, but sustained temperatures above 85–90°C under normal workloads are generally worth investigating. Check your CPU manufacturer’s maximum safe temperature for an exact figure.
Is 80°C too hot for a CPU? Not necessarily. Many CPUs run at 80°C under heavy load without issue, especially during stress testing or gaming. It becomes a concern if it happens during light tasks or if it’s paired with throttling and instability.
What should my CPU temperature be while gaming? Most CPUs run somewhere between 60–75°C during gaming, though this varies based on the processor and cooler. What matters more is whether temperatures stay stable rather than climbing continuously.
How can I monitor CPU temperature in Windows? Install a dedicated CPU heat monitor such as HWMonitor, Core Temp, or HWiNFO. These run in the background and display live temperature data on your desktop or system tray.
Does high CPU temperature reduce performance? Yes. When a CPU gets too hot, it reduces its clock speed to cool down — this is called thermal throttling, and it directly lowers performance until temperatures come back down.
How do I reduce CPU temperature? Clean dust from your system, improve airflow, check your cooler and fan, replace old thermal paste, and adjust fan curves. These steps address the most common causes of elevated CPU temperatures.
Conclusion
A CPU heat monitor isn’t just a tool for enthusiasts — it’s a practical way to understand what’s actually happening inside your PC. Keeping tabs on your temperatures, especially during gaming or heavy workloads, helps you catch cooling problems early, avoid thermal throttling, and protect your hardware over the long run. Once you know what’s normal for your specific setup, checking in periodically only takes a few seconds — and it can save you a lot of troubleshooting time down the road.



[…] How to Check CPU Temperature […]